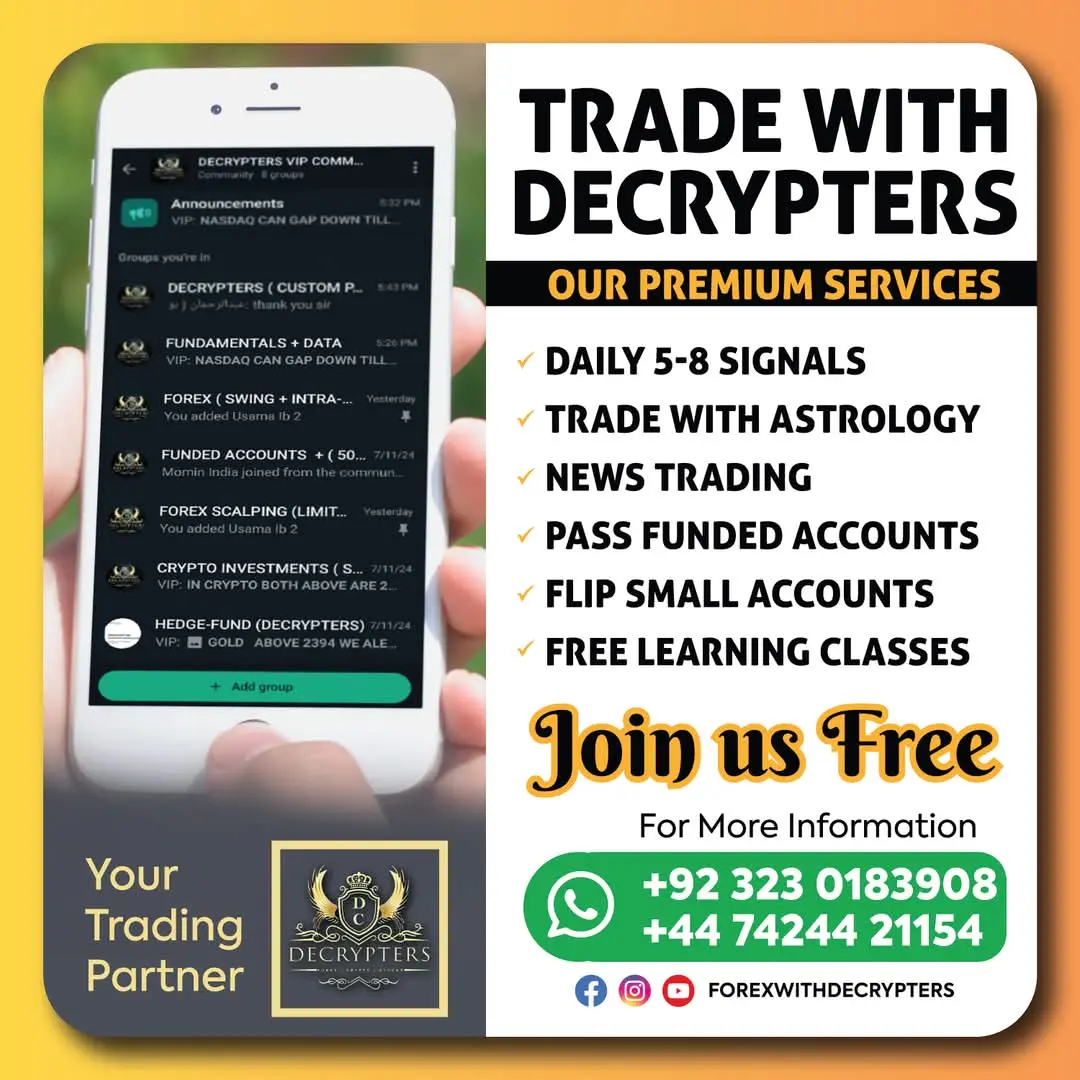
Master Forex & Crypto Trading With Decrypters
Join Trade With Decrypter - the reliable trading signal provider trusted by thousands of traders worldwide. Get daily Forex and crypto trading signals and master Forex strategies.
Why Trade With Decrypter?
At Trade With Decrypter, we help traders of all levels learn how to trade Forex and crypto confidently. Our expert team delivers real-time currency trading signals, cutting-edge technical analysis tools, and one-on-one mentorship — everything you need to trade smarter and win more.
High-Accuracy Trading Signals
Daily Forex and crypto signals with clear entry, stop-loss & take-profit
Proven Forex Strategies
Time-tested methods to grow your account
Crypto Price Alerts
Stay ahead of fast market moves
Beginner Trading Platform Support
Simple setups and easy-to-follow signals
Expert Mentorship
Get personalized training from seasoned analysts
Global Community
Join 1,000+ traders who trust Decrypter
OUR SERVICES
What We Offer
Forex Trading
Learn market strategies for daily profit growth.

Crypto Trading
Explore the world of cryptocurrency trading.
Trading News
Stay updated with latest market insights and trends.

Astrology Signals
Unique trading signals based on astrological analysis.
Education
Comprehensive trading education and learning resources.
OUR SERVICES
What We Offer
Forex Trading
Learn market strategies for daily profit growth.
Crypto Trading
Explore the world of cryptocurrency trading.
Trading News
Stay updated with latest market insights and trends.
Astrology Signals
Unique trading signals based on astrological analysis.
Education
Comprehensive trading education and learning resources.
Ready to Trade Like a Pro?
Join the fastest-growing Forex and crypto trading community. Access real-time signals, technical analysis tools, and expert mentorship — all under one roof.
Our Bonus Offer


Why Choose Us
Our goal is to provide our investors with a reliable source of high income, while minimizing any possible risks and offering a high-quality service.
Real-time High-Accuracy Signals
Stay ahead of the market with instant, accurate trading signals backed by analytics.
Experienced Analysts & Traders
Our expert team brings years of trading experience to guide your investment journey.
Performance-Backed Strategies
Every strategy we share is data-driven and tested for consistent performance.
Beginner to Pro Mentorship
Whether you're new or seasoned, our step-by-step mentorship helps you grow.
Active Global Community
Join a passionate network of global traders sharing insights and growing together.
Secure & Transparent Platform
We prioritize your safety with robust security measures and full transparency in every trade.
Our Latest Youtube Videos


Subscribe to our channel for daily trading insights and market analysis
Ready to Trade Like a Pro?
Join thousands of successful traders. Fill out the form below to start your trading journey with personalized guidance.